Predicting Hurricanes Based On A Plethora Of Models
Jul 17, 2020
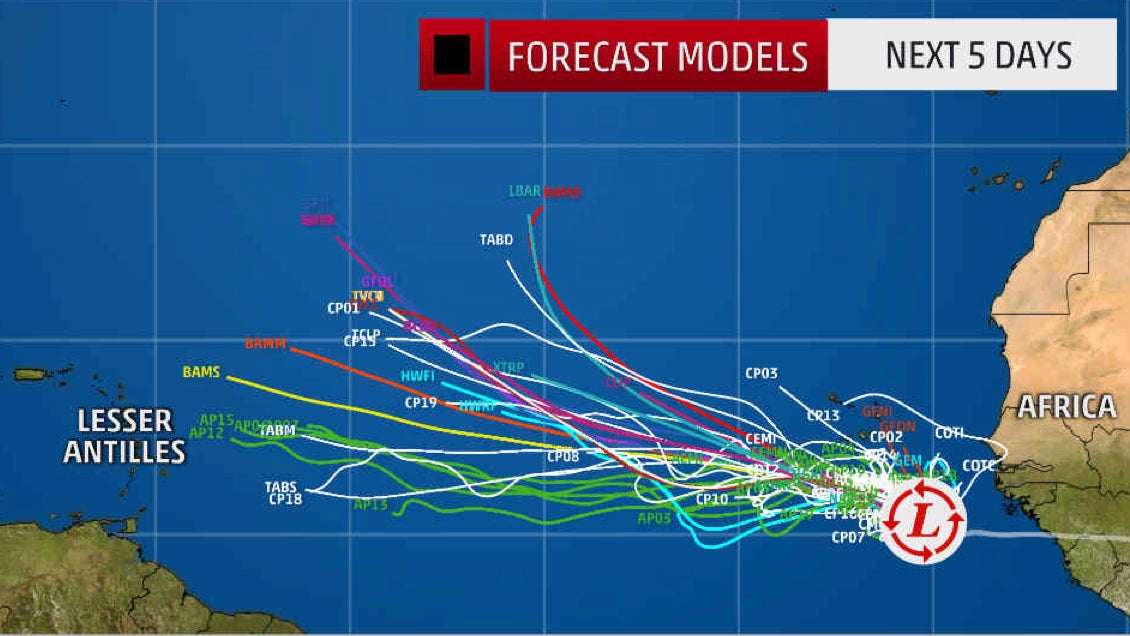 Photo from www.weather.com
If you live in a hurricane vulnerable section of the United States, then you are probably aware that predicting hurricanes is based on a plethora of models from a number of weather forecasting organizations. The models show the direction in which the storm is expected or predicted to travel. Each model is designated in a particular color when storm predictions are first released to the public. The map of predictions look similar to color strands of spaghetti, thus the term spaghetti models.
Also referred to as “spaghetti plots,” the forecast models’ lines of direction is only meant to show where the storm is going and is a loose representation of when the storm is expected to reach landfall.
The lines of direction are set within a so-called “cone of uncertainty.” Each line or model shows the possible impact of the storm.
To create the cone of uncertainty, meteorologist focus on the center point of the tropical system, which may or may not be its accurate route.
The lines don’t provide any information about how much rainfall there will be, nor the force of the winds, the surge or other important data. The spaghetti model only provides the center of the storm’s future track.
When Spaghetti Models Are Essentially Useless
There are a few occasions when the spaghetti models are essentially useless.
One scenario involves the development of a tropical storm system. Tropical storms at the end of their formative period are still trying to attract thunderstorms to their left-front side, especially when they are gaining latitude. This side of the storm is commonly the weakest. The wind and the forward speed of the developing storm are on the opposite side.
When wind shear and/or dry air from one side of the system is thrown into the calculation, they influence the other side of the storm. Sometimes this pushes the storm away from the directional line a model has given it.
When a landmass is on the left side of the storm, then you may predict that the storm will travel to about 10 to 50 miles off the coast. However, the wind shear and/or dry air on one side of the system, the thunderstorms and higher winds are in the Atlantic, not over the coast, even if the storm is very close to shore.
So, the spaghetti model didn’t really yield any useful data for where the storm will strike the coast.
Another limitation to spaghetti models is that they don’t indicate any sign of the intensity or size of the storm. This data is commonly on different charts that focus on an individual model.
A major benefit of spaghetti models is that when most of the models overlap, there is strong confidence in the forecast. That’s because most of the models agree even though they get to this conclusion in different methods.
Another benefit of using a number of models is when many of them show similar ideas and stay consistent with those ideas. When models change over time this means that either the atmosphere is changing or the model does not have a good idea of what’s going on.
Models commonly run for a period of six hours.
Each Model Has A Different Purpose
Although each model works on the goal of being the very best, each is focused on a different variable. Some models rely on statistics, others depend on atmospheric dynamics, still others are constructed on other models, and some more are built on climatology and persistence of the current atmosphere.
Two models –- the CLP5 and the XTRP –- always appear in the spaghetti model, but neither includes any useful data about the forecast.
The CLP5 depends on past weather conditions or analogs. It analyzes what similar storms have done in the past.
The XTRP just extends the storm’s recent motion five days into the future, creating a straight line.
Tropical Storm Models
There are 13 models commonly used to predict tropical storms in the United State.
Notable Tropical Storm Models
(From the National Hurricane Center
| Model Name | Model Type | Main Use |
| American GFS | Dynamical | Global Model |
| ECMWF or European | Dynamical | Global Model |
| CMC | Dynamical | Global Model |
| UKMET or EGRR | Dynamical | Global Model |
| HWRF | Dynamical | Hurricanes |
| HMON | Dynamical | Hurricanes |
| GEFS/AEMN | GFS Ensemble/Consensus | Estimate of Model Confidence |
| EEMN | Euro Ensemble/Consensus | Estimate of Model Confidence |
| TVC# | Track Consensus | Estimate of Forecast Confidence |
| TABs | Trajectory | Estimate of Shear |
| LBAR | Basic Dynamical | |
| CLP5 | Statistical | Climatology |
Some models track the winds and are collectively called TABs or Trajectory and Beta models.
Models that are shallow, medium and deep are fairly useful because the closer they are together signifies that there is less wind shear in the atmosphere. On the other hand, if they are spread out, this signifies that there is more wind shear and the system will likely stay weak.
Statistical-dynamical weather models are a little more sophisticated than the others. These models combine statistics including storm location, time of year, and what hurricanes of the past have performed simple dynamics including steering flow.
The most sophisticated models are the dynamical models that take the current state of the atmosphere using observations from the ground, ocean, and air as well as sophisticated physics equations into account.
When Forecasting Using Ensembles Is Most Beneficial
Ensemble modeling is beneficial when forecasting a storm 3 to 7 days in advance. The group can include more than 50 weather models with different levels of correctness and experience.
The most well known models that use ensembles include the European, GFS, and Canadian. An ensemble is a collection of forecasts that include useable forecasts at the same forecast time.
For example, the GFS runs 21 times with marginally variable initial conditions and physics.
Models that include ensembles are the most reliable in most medium to long-term forecasts. If models including ensembles are tightly packed close together in a 3 to 7 day period, then the confidence of a prediction is higher. However, the models with ensembles should be checked against one another to ensure that each is buying into the other’s ideas.
If the models that feature ensembles that are spread apart within 2 to 4 days, then one can assume that there is less confidence in the forecast.
People who live in parts of the United States that are vulnerable to hurricanes should watch model predictions closely. Knowing that a hurricane may be bearing down on your location would be helpful. However, if you don’t have a stand-alone generator to ensure your home is powered during a storm, then your only alternative is to pack up and evacuate. If you have a generator, then you have peace of mind as you watch the storm models evolve into a definitive forecast of where the storm is going.
APElectric offers a wide range of stand-alone generators from such manufacturers as Cummins, Westinghouse, Kohler, Briggs & Stratton, Generac, Firman, and Guardian. They have a large inventory to choose from. Many models feature Wi-Fi so that you can monitor and control the generator from anywhere on Earth. The website also includes a generator sizing calculator and offers information on how to select the proper generator for your situation.
Now more than ever it is essential that you be prepared. Visit the APElectric website and browse their supply of generators. Purchasing one can give you peace of mind during these crazy storm seasons.